A Wordle Case Study To Better Understand Twitter Interactions
This Article Is Based On The Research Article 'Understanding Twitter conversations: A Wordle case study'. All Credit For This Research Goes To The Researchers 👏👏👏

Please Don't Forget To Join Our ML Subreddit
Understanding how conversations happen on Twitter is crucial: what are people talking about, who utilizes new features, and how are they using them? These kinds of analyses can help better understand the consumers. That is, in fact, how the iconic hashtag was born. Twitter handles around 400 billion events in real-time and creates petabytes of data every day to put things in perspective. Data is then organized into several datasets for simple retrieval.

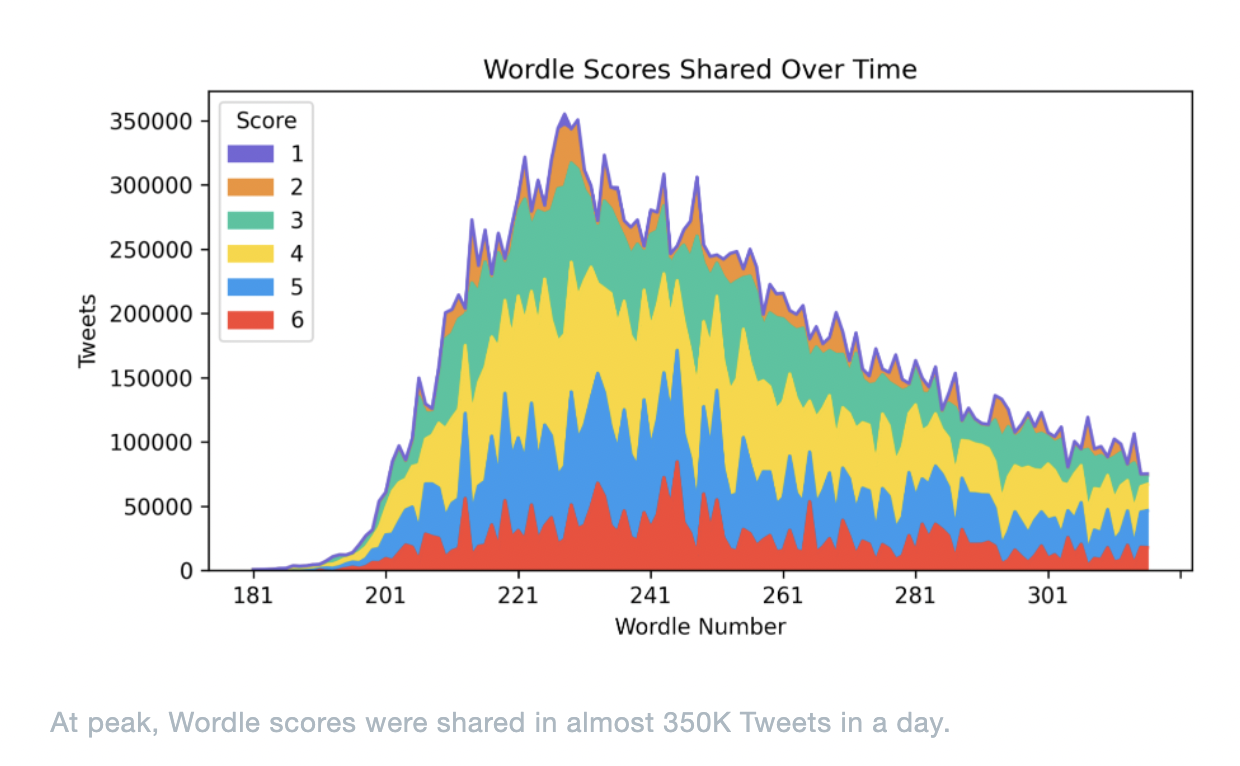
Most of these datasets are now in BigQuery, making data analysis quick and easy. One current popular subject of discourse on Twitter is Wordle – because it has a simple way to access the over 1 trillion public Tweets and their related information. Wordle has been cited in 32.2 million Tweets by 3.3 million individuals since its inception in mid-October 2021. Wordle buzz on Twitter exploded from 400 Tweets per day in December to 500K Tweets per day at its peak. Wordle-related tweets have received over 6.6 billion views, 58 million likes, and 9 million replies.
It’s fascinating to observe how Wordle expanded worldwide by looking at images over time. The degrees of shade on the map below represent the percentage of Tweets each day in each nation that mentions Wordle, with dark green indicating that more than 1% of Tweets in that country that day were about Wordle.
Wordle swiftly became popular across the world, beginning in New Zealand. On Wordle, many users have enjoyed sharing their scores. There have been 23.5 million Tweets sharing English Wordle scores from 2.1 million users since the implementation of the share button on December 16.

It may then be guessed whether riddles were particularly simple or complex based on the distribution of scores provided over time. Normalizing the Wordle scores shared each day allows observing whether puzzles had a large proportion of low or high scores, making educated guesses regarding the word’s complexity. The average solved score shared by those who Tweeted a solved score was 4.1. It appears that such repeated-letter words threw people off, as shown below.

When looking at the distributions of when individuals published their Wordle scores on Twitter, it’s clear that many people stay up until midnight to finish the puzzle as soon as it’s released — over a quarter of India’s scores were shared between 12 am, and 1 am. While average scores shared at various times do not differ significantly, scores shared between 6 am, and 9 am are the lowest. Therefore it may be better to be a morning Wordler!

Once an essential examination of the data has been performed, more profound hypotheses may frequently be created and tested. Researchers wish to go deeper into the data to learn more about the factors that contributed to this issue’s virality on Twitter, such as what other material was discussed in combination with Wordle and what sorts of Twitter account holders are most interested in this topic.
Large-scale polls of Twitter users may be conducted to uncover broad patterns. The qualitative partners conduct surveys with a considerably smaller number of clients, but they can go far more profound. Understanding behaviors through statistics, surveys, and interviews provide a far deeper picture than relying solely on one data source.
While Twitter is delivering a new feature or researching the release of a new feature, data science, quantitative, and qualitative partners collaborate to thoroughly understand the area and the requirements of the Twitter community. These three partners’ input is crucial in determining the design and operation of features and which features Twitter should deploy.
The Twitter API is an excellent tool for extracting data and studying Twitter behavior on your own. To dig deep, follow this link.
Source: https://blog.twitter.com/engineering/en_us/topics/insights/2022/understanding-twitter-conversations–a-wordle-case-study
Credit: Source link
Comments are closed.