DoorDash Introduces Dash-AB: A Centralized Library For Statistical Analysis

Every change in a data-driven firm must be tested through trials to guarantee that it has a positive, measurable impact on key performance measures. Every month, thousands of trials are running in parallel at DoorDash. To guarantee that this volume of testing is possible, the results of each experiment must be assessed swiftly and precisely. Managing thousands of trials can be difficult due to greater complexity, a wider range of needs, and sheer scale.
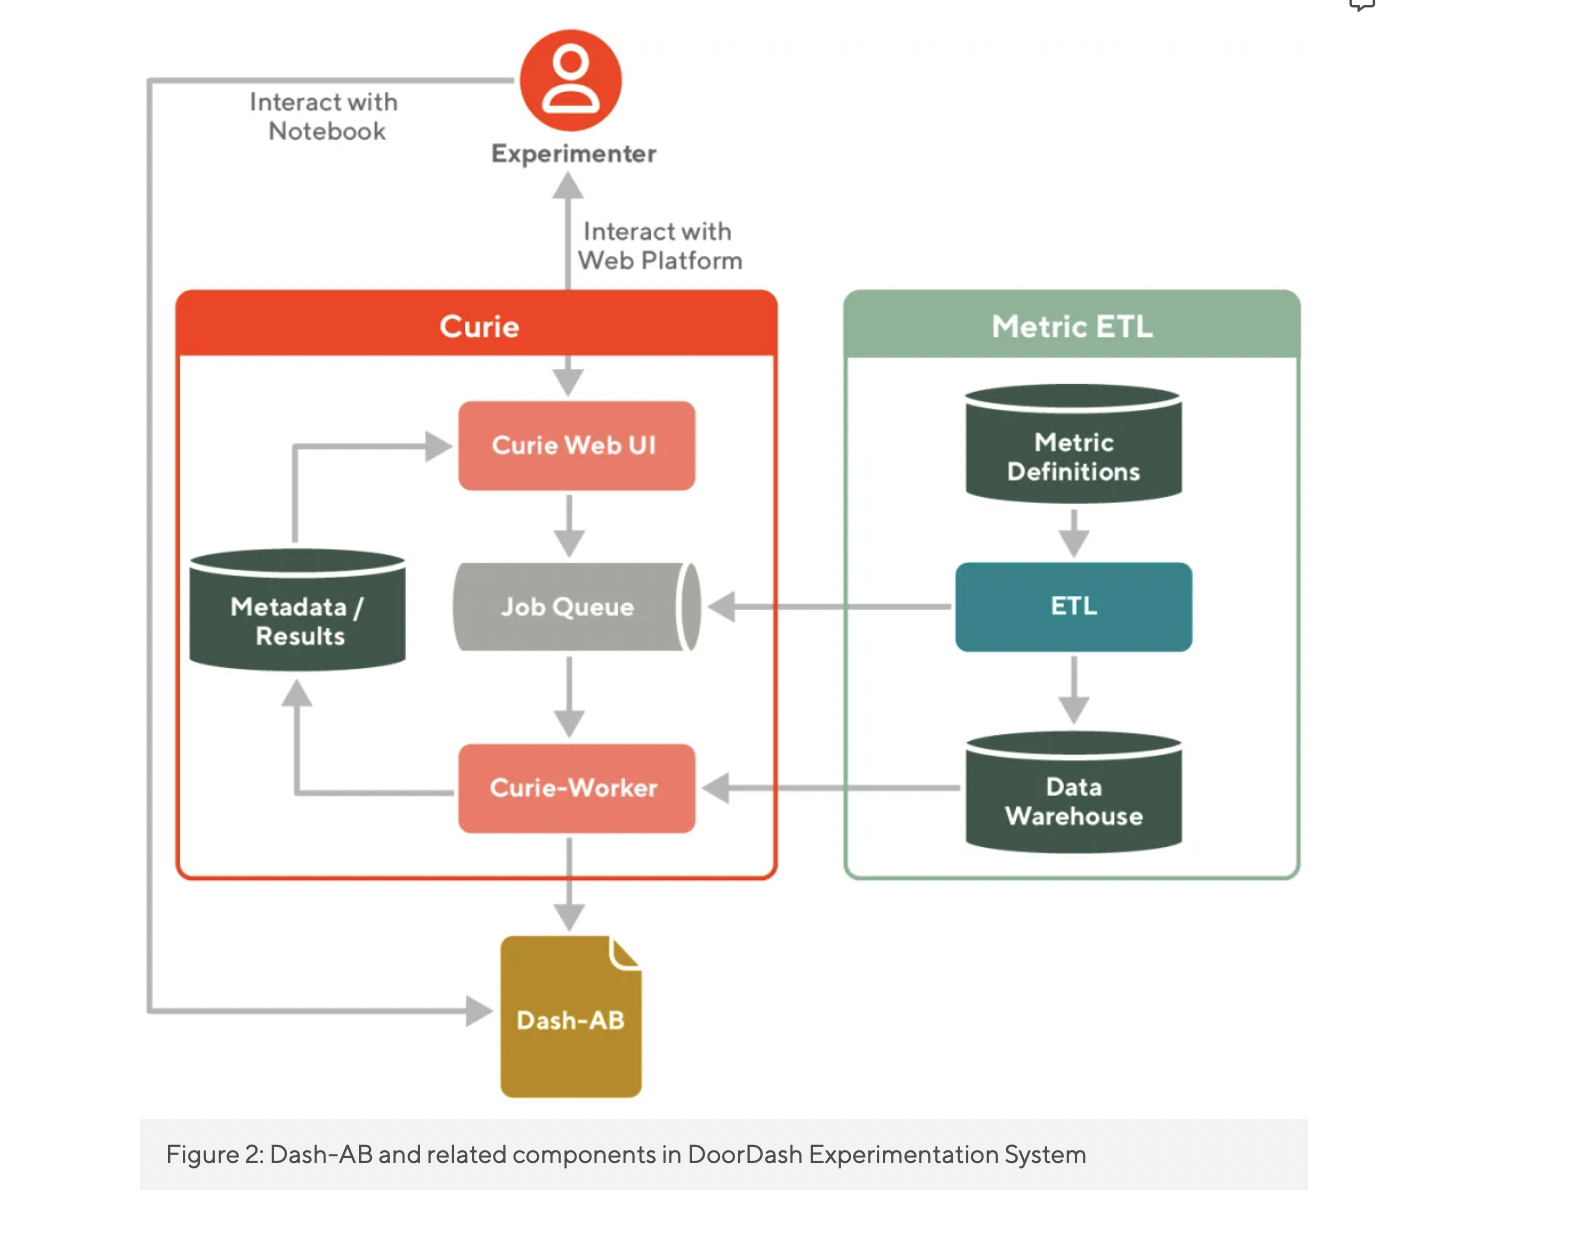
DoorDash team designed Dash-AB, a centralized library for statistical analysis, to address these obstacles. This toolkit is linked to Curie’s experimentation platform, which allows them to test consistently, reuse complicated statistical methodologies, and operate more quickly at scale.
The DoorDash team sought to standardize their experimentation processes to facilitate testing every feature via experiments before it could be launched. At DoorDash, there was previously no consistency for experiment analysis, making it impossible for analysis to keep up with the rate of experiments. Data scientists reinvented the wheel due to a lack of standards, which resulted in error-prone analysis results, sluggish learning, and wasted work.
As a result, they constructed a statistical engine to standardize experiment analysis and serve as a single location for incorporating best practices to expand their experimental capacity.
Because of the large range of distinct use cases across DoorDash’s product teams, creating a central statistical analysis engine is difficult (e.g., experiments on the logistics side are very different from experiments on the consumer’s side). The library must meet the following requirements:
- Assurance of the quality of any experiment result should be reasonably accurate, resilient, and sensitive to the business.
- User-friendly: Users should be able to learn how to utilize the library quickly and efficiently.
- Adaptable to the rapidly expanding experiment volume: The library should be able to produce findings quickly, even with larger inputs.
- Provide comprehensive coverage of the problem domains: Diverse approaches, experiences, and metrics must be included in the library to accommodate different use cases for different product teams.
The initial stage in developing Dash-AB was to create a user interface that could be used by those unfamiliar with statistics. Experimenters only need to provide Dash-AB with a json config (as seen below), including experiment and metrics data, and the library will handle the rest.
When a new experiment is added to the experimentation platform, it will go through a pipeline that includes:
Validation
Dash-AB performs a few validation checks on the data before starting the analysis, including:
- Imbalance check to see if the bucket ratio is set correctly. A sample ratio mismatch could lead to experiment results being skewed. As a result, it’s critical to perform this check very away to guarantee that the results are correct.
- Perform a flicker test to see if any entities are bucketed into both the treatment and control groups.
Calculation of variance and reduction of variance
Dash-AB begins the computation of variance, which is the most crucial stage in the pipeline, after evaluating the data quality. Dash-wide AB’s methodology for computing variance enables support for various experiment use cases, including metric aggregation functions, variance reduction, and study of interaction effects across several trials or features.
Variance reduction is a technique for increasing the power or sensitivity of an experiment so that it may be completed more quickly. The control covariates approach is the most widely utilized variance reduction method in Dash-AB. The team uses two main types of variance reduction approaches as of now:
- CUPED: Covariates are pre-experimental average metric values.
- CUPAC: ML predictions are used as covariates.
The DoorDash team remarks that using these two variance reduction strategies reduces the sample size required for statistical significance by 10% to 20%.

Testing hypotheses
Dash-AB then moves to the hypothesis testing step, where it calculates statistics such as the p-value and confidence interval.
The team mentions that sample size calculations are required to determine an experiment’s end date. Therefore, they gave included a pipeline for calculating sample sizes. To help with the calculation, they created a sample size calculator UI on the platform.
The researchers state the lack number of locations for randomized testing. To meet this issue, they use Diff-in-Diff analysis while experimenting on a regional level. Dash-AB has a Diff-in-Diff pipeline that takes care of the matching process and p-value and confidence interval analyses.
The team hopes that their work will serve as a useful guide for other firms looking to increase their development while being data-driven and for thinking about development difficulties and the different techniques that experiments require to be reliable and efficient.
This summary article is written by Marktechpost Staff based on the Doordash Research Article 'Meet Dash-AB — The Statistics Engine of Experimentation at DoorDash'. All Credit For This Research Goes To The Researchers of This Project.

Please Don't Forget To Join Our ML Subreddit
Credit: Source link
Comments are closed.