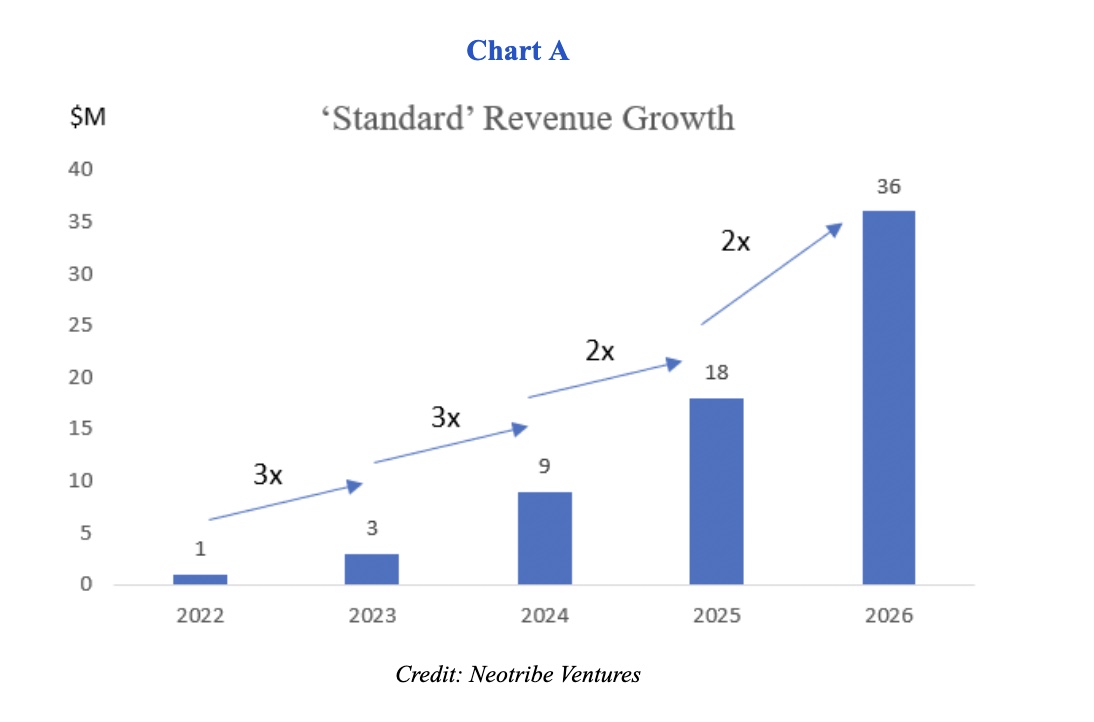
Over the last several years, VC money has been abundant and relatively cheap. This created an environment where everyone’s motto became, “growth at all costs.” Seemingly, the recipe for a successful venture-backed company became very cookie-cutter: Raise capital every 18 months; invest heavily in go-to-market; grow revenue at a ‘standard’ rate that triples in year 1, triples again in year 2, and then doubles thereafter.
These “VCisms” borne out of an era of plenty have permeated boardrooms and investor meetings everywhere. In fact, the question, “How long do you expect the capital raised to last you?” essentially became a test of intelligence. The only right answer was 18 to 24 months, without any consideration of the specific circumstances of the company.
People may not be saying it aloud yet, but these VCisms are starting to feel outdated. Growth at all costs doesn’t work when capital isn’t readily available or when it is very expensive from a dilution perspective. And, raising capital every 18 months feels very onerous when it no longer takes one month to raise a round and instead takes three to six months or longer.

Image Credits: Neotribe Ventures
It’s time to ask ourselves if these VCisms are still relevant or if it’s time to change. First, let’s take a look back.
How did we get to a ‘growth at all costs’ mentality?
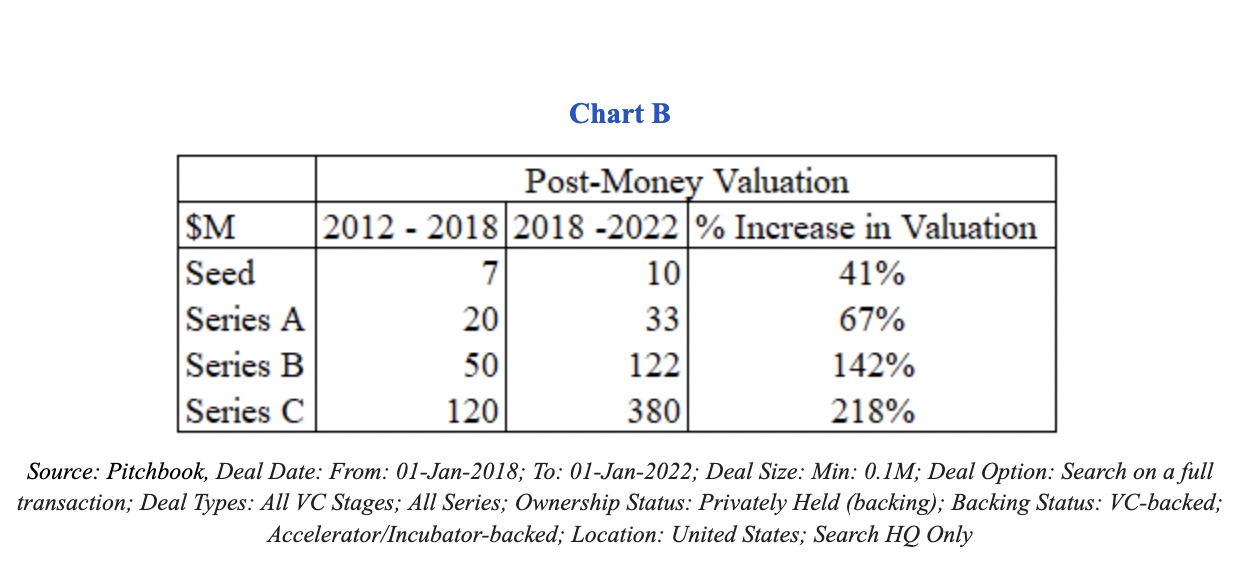
At this point, it’s common knowledge that the cost of capital has declined in recent years. This is mostly discussed by referring to the increased valuations companies were receiving at varying stages, as shown below in Chart B.

Source: Pitchbook data from 2012 – 2022. Image Credits: Neotribe Ventures
The sooner we start having company-specific conversations and acknowledge that the cookie-cutter recipe for success isn’t sufficient, the better for all parties involved.
Across all stages, companies were seeing higher post-money valuations, anywhere from about 40% at the earliest stages to over 200% in the growth stages in the 2018 to 2022 period, compared to 2012 to 2018.
Put another way, over the last three years, a company could raise the same amount of capital for less dilution.
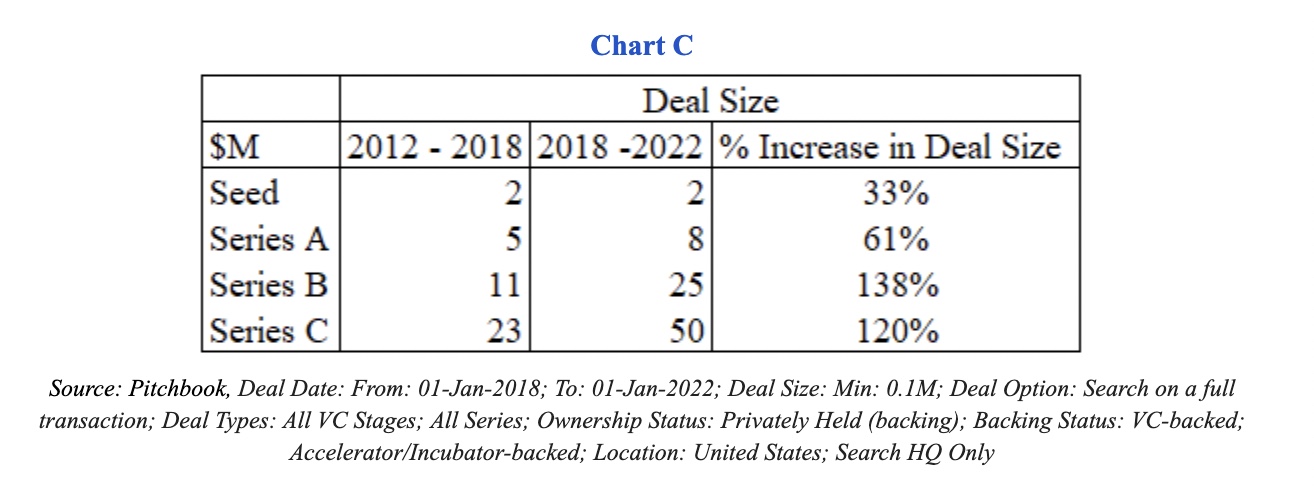
But what isn’t talked about often is the fact that the data shows us that companies did not, in fact, raise the same amount of capital. They raised more capital at each stage — significantly more. As Chart C shows, the median Series C more than doubled in size over the last several years compared to the 2012 to 2018 time frame.

Source: Pitchbook data from 2012 – 2022. Image Credits: Neotribe Ventures
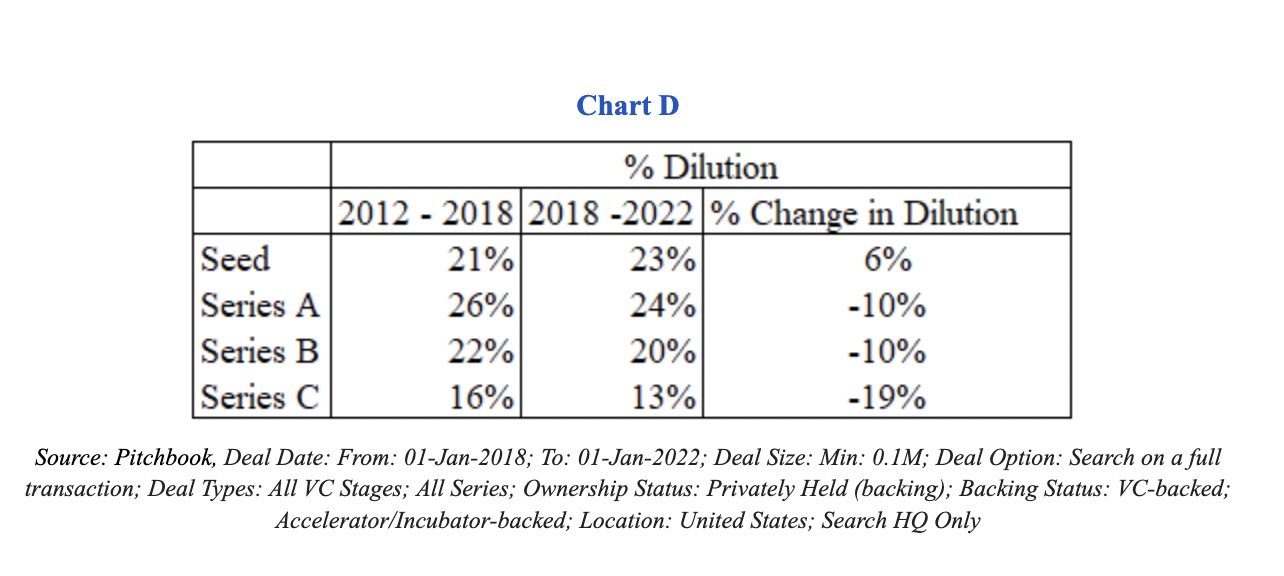
On average, companies saw slightly less dilution, as shown in Chart D below.

Source: Pitchbook data from 2012 – 2022. Image Credits: Neotribe Ventures
For example, existing equity holders (Seed and Series A investors and founders) saw dilution of a median 22% during subsequent Series B rounds between 2012 and 2018, while their equity was diluted by only about 20% between 2018 and 2022. That’s only a 10% difference.
Notably, companies received more than twice the capital for this dilution (i.e. $25 million versus $11 million, as noted in Chart C) in the past three years. This capital could be used to fuel growth with marketing and by hiring salespeople.
If investors saw similar levels of dilution, does that mean that they saw similar returns?
Definitely not.
Let’s compare the two time periods. Between 2012 and 2018, the median valuation of a Series C company was $120 million. Assuming an investor received 15% ownership in a Seed round for an around $1 million check, and then saw their stake being diluted in each round thereafter, the data indicates that their ownership after the Series C raise would be about 7.2%.
Credit: Source link


Comments are closed.