Meet Pyinstrument: A Python Profiler Tool To Optimize Your Code And Make It Faster
Software engineering encompasses more than merely producing readable, high-quality code. For the optimal user experience, a well-written, scalable application should also achieve remarkable performance. This is where code profilers can come into play. Developers use profilers to determine and rectify bottleneck constraints, such as finding answers to questions like how frequently each line of code is executed or how long a method takes. Moreover, profilers are also useful for monitoring garbage collection and memory allocations.
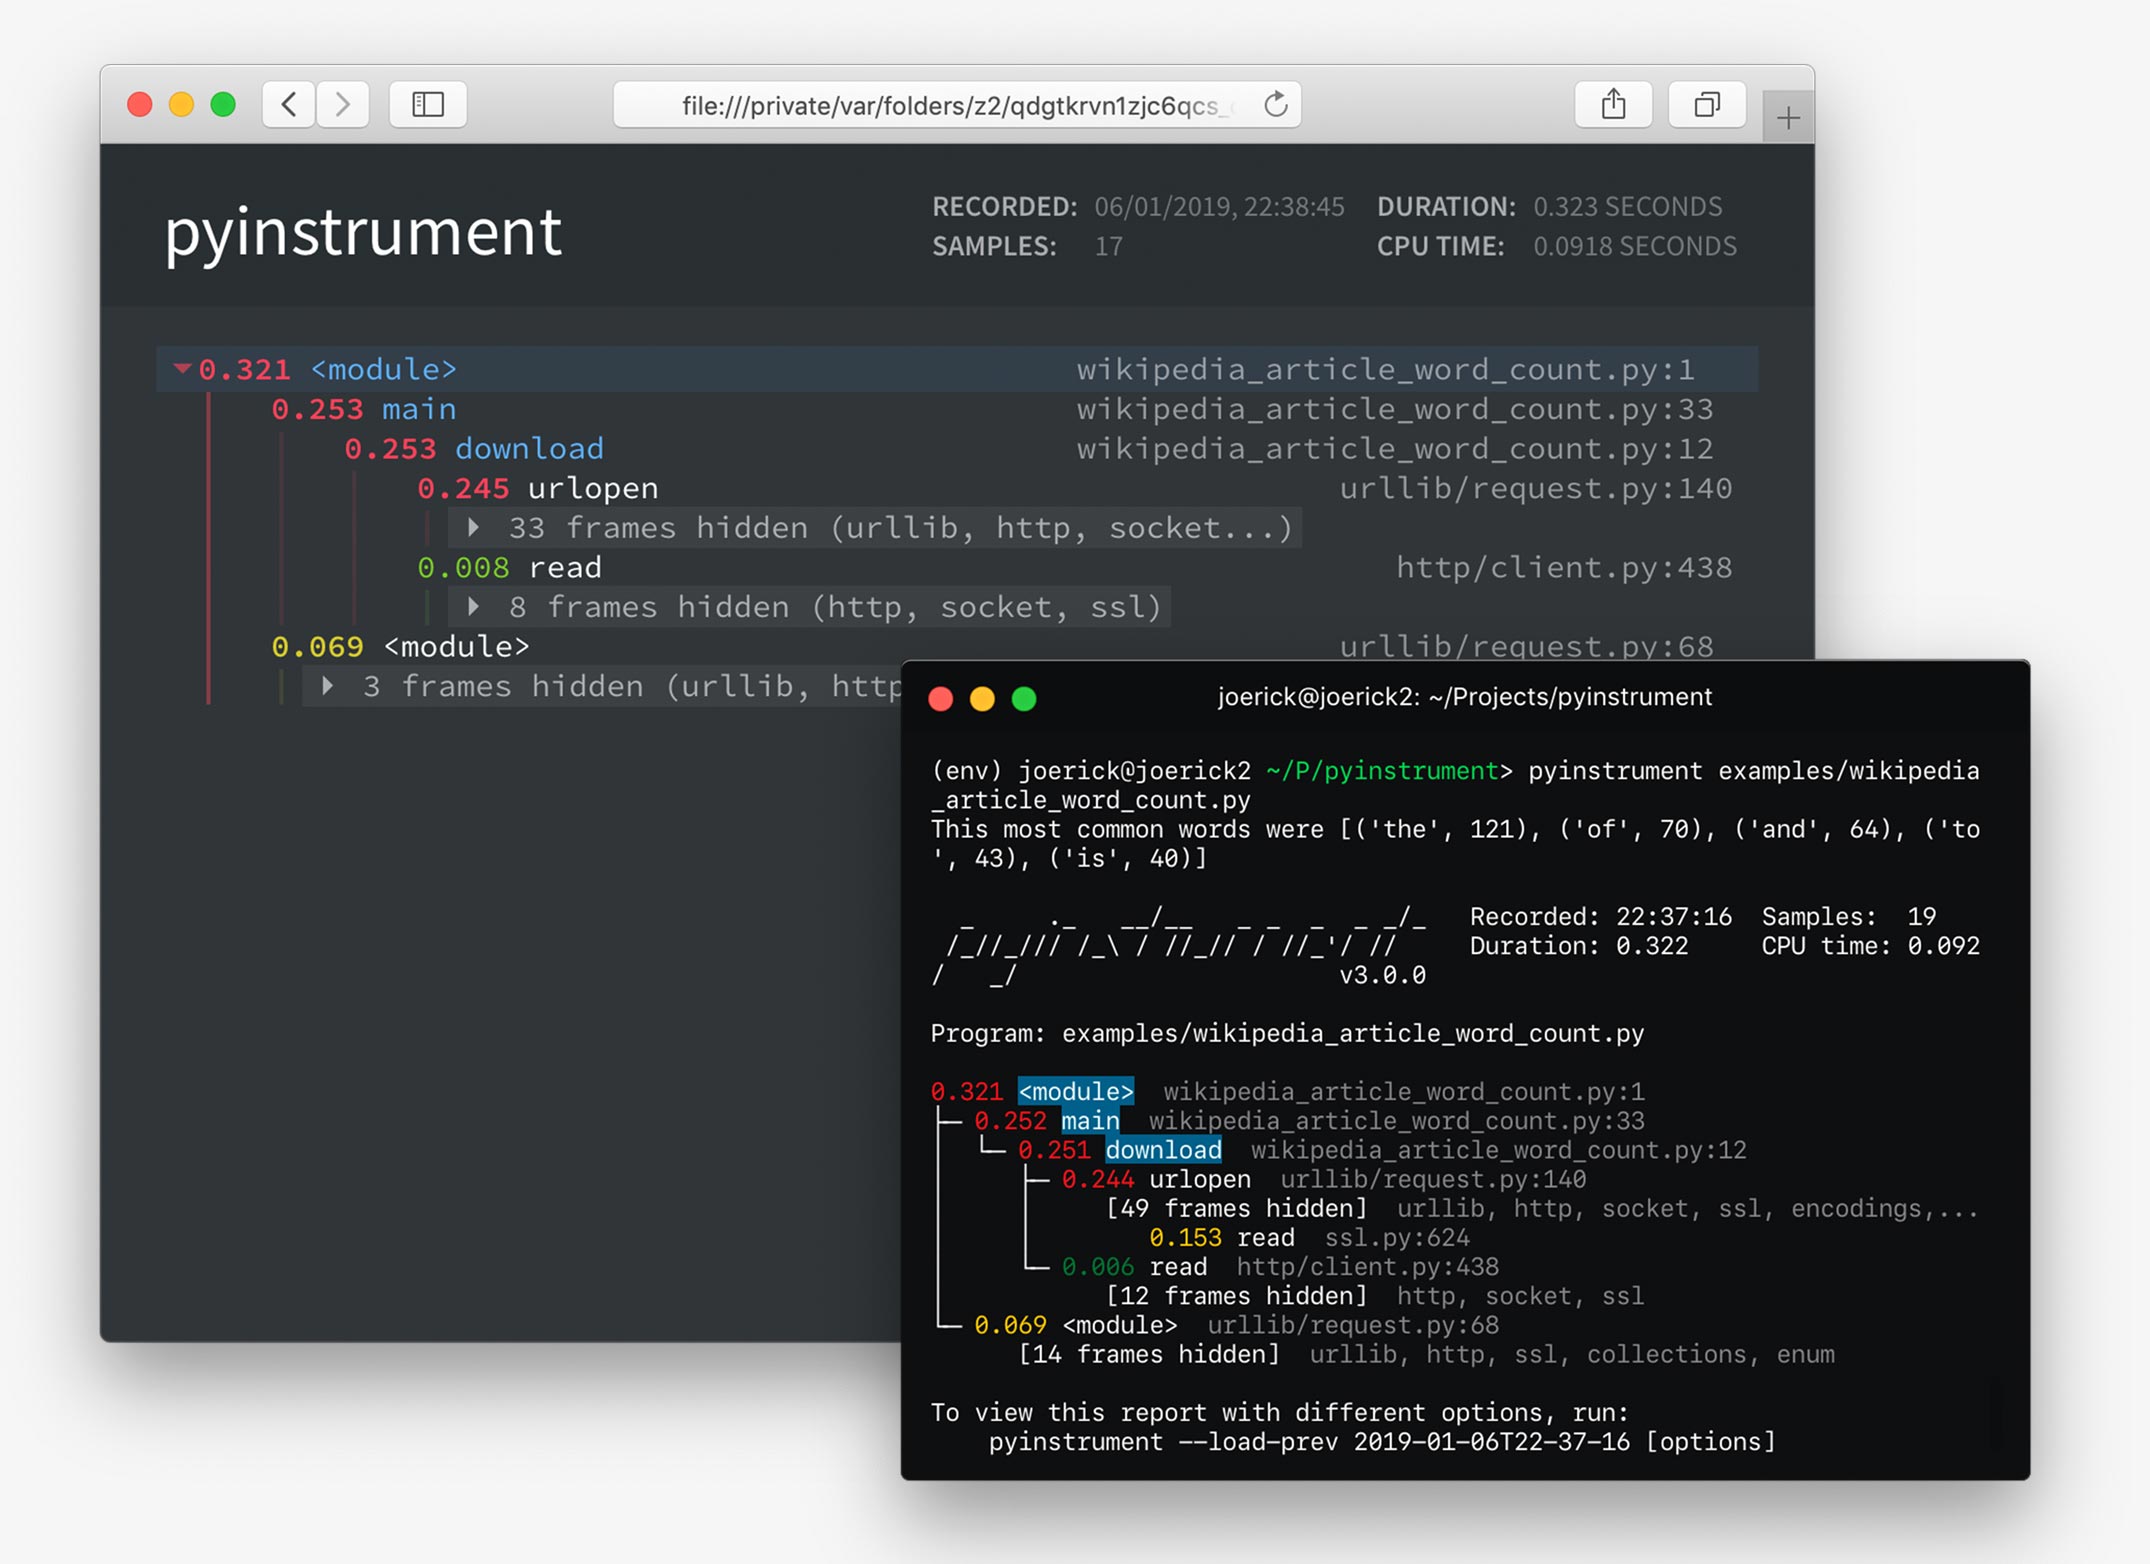
Coming to examples of different profilers, Pyinstrument is one such recent Python profiler tool that aids programmers in code optimization and achieving exceptional performance. Pyinstrument enhances the speed of the program by finding its slowest area. It accomplishes this by keeping track of how the application runs and then presents a report highlighting the areas that run slowly. Currently, Pyinstrument is compatible with Python 2.7 and versions 3.3 and higher.
Using a C extension and PyEval_SetProfile, Pyinstrument operates by halting the application every 1 ms and recording the full call stack up to that point. As the profiler records the call stack every 1 ms and does not explicitly track every method call, Pyinstrument is a statistical profiler. Statistical profilers have significantly lower overhead than tracing profilers, which offers them an upper hand. Other common profilers frequently produce a report that lists functions in descending order of time spent in each function. If this data contained information on why certain functions are being called and which section of the code does so, it would be even more useful to the developers. Since Pyinstrument captures the entire call stack, making it much simpler to track expensive calls.
Additionally, Pyinstrument also logs duration using ‘wall-clock’ time rather than CPU time, which includes the time required for any demanding features like downloading data and communicating with databases. Since Python is frequently used as a “glue” language between different services, this distinction is even more obvious when troubleshooting performance problems. The profiler is available as a command line interface and a Python API, making it very user-friendly. A whole script can be profiled using the command line interface, and certain pieces of the code can be profiled using the Python API. Despite being a very powerful tool, Pyinstrument is not error-free. There are certain known issues listed on its GitHub repository. However, updated versions of the profiler with fixed bugs are consistently being released.
Check out the Python Tool and Documentation. All Credit For This Research Goes To the Researchers on This Project. Also, don’t forget to join our Reddit page and discord channel, where we share the latest AI research news, cool AI projects, and more.
![]()
Khushboo Gupta is a consulting intern at MarktechPost. She is currently pursuing her B.Tech from the Indian Institute of Technology(IIT), Goa. She is passionate about the fields of Machine Learning, Natural Language Processing and Web Development. She enjoys learning more about the technical field by participating in several challenges.
Credit: Source link
Comments are closed.